Get your copy of Paul Forchione's book describing advanced techniques on futures options. Learn techniques from a professional options trader to manage risk while speculating on futures markets.

Click here to view Paul's eBook
By using our website, you agree to accept our terms of use (click to read)
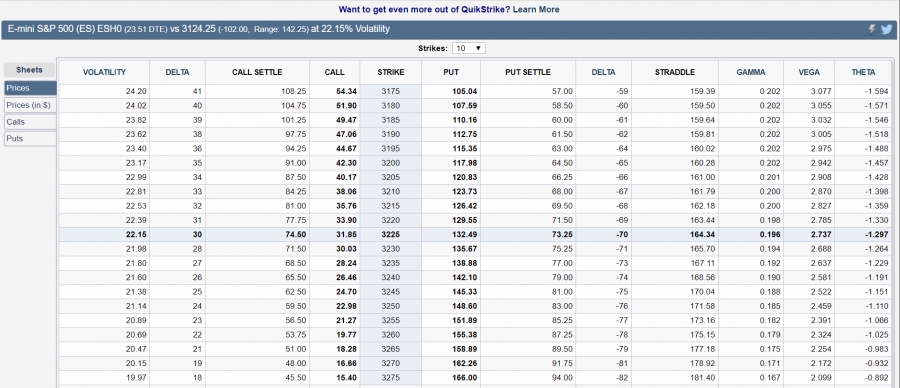
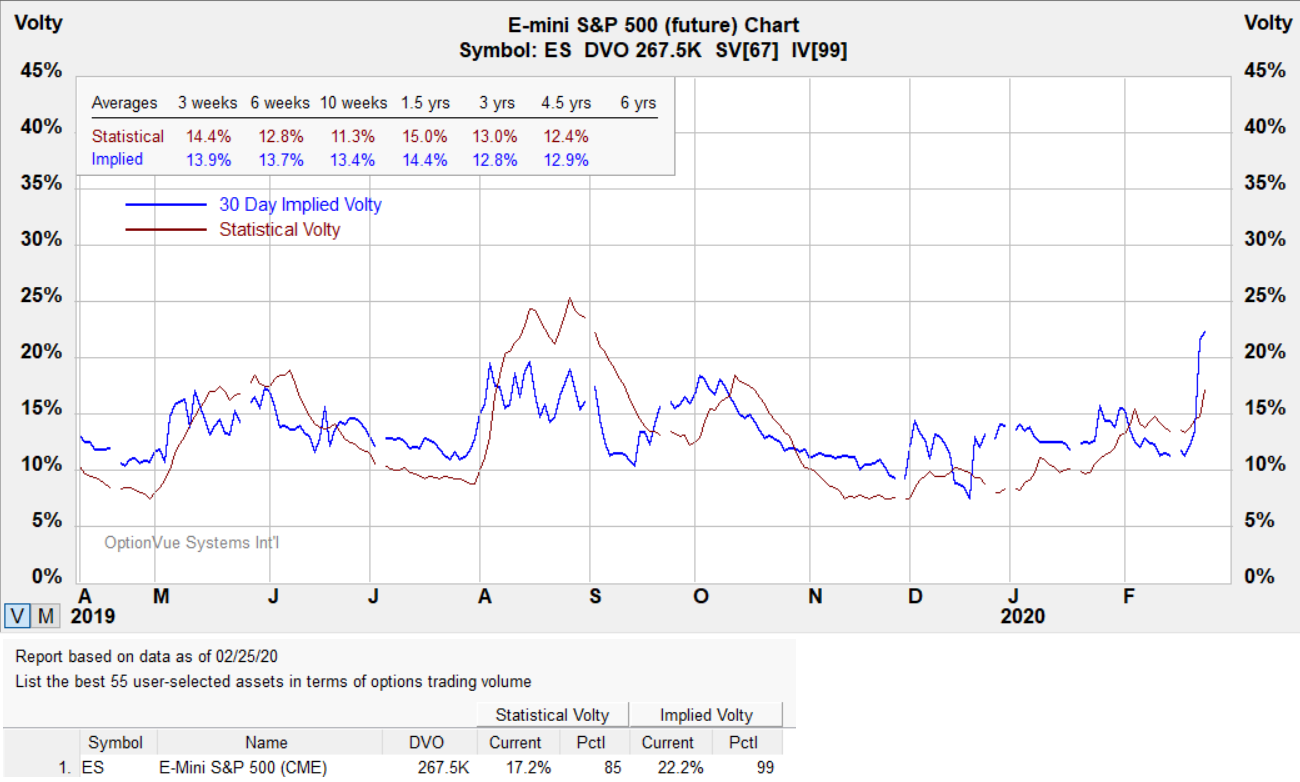
Volatility
Notes:
Contract Size - $50 x S&P 500 Index.
Tick Size: Outright: 0.25 index points=$12.50
Trading Hours: CME Globex: Sunday - Friday 6:00 p.m. - 5:00 p.m. Eastern Time (ET) with trading halt 4:15 p.m. - 4:30 p.m.
?ml=1" class="modal_link" data-modal-class-name="no_title">* Tip: Click here to read a helpful tip about E-Mini S&P futures and options
E-Mini S&P
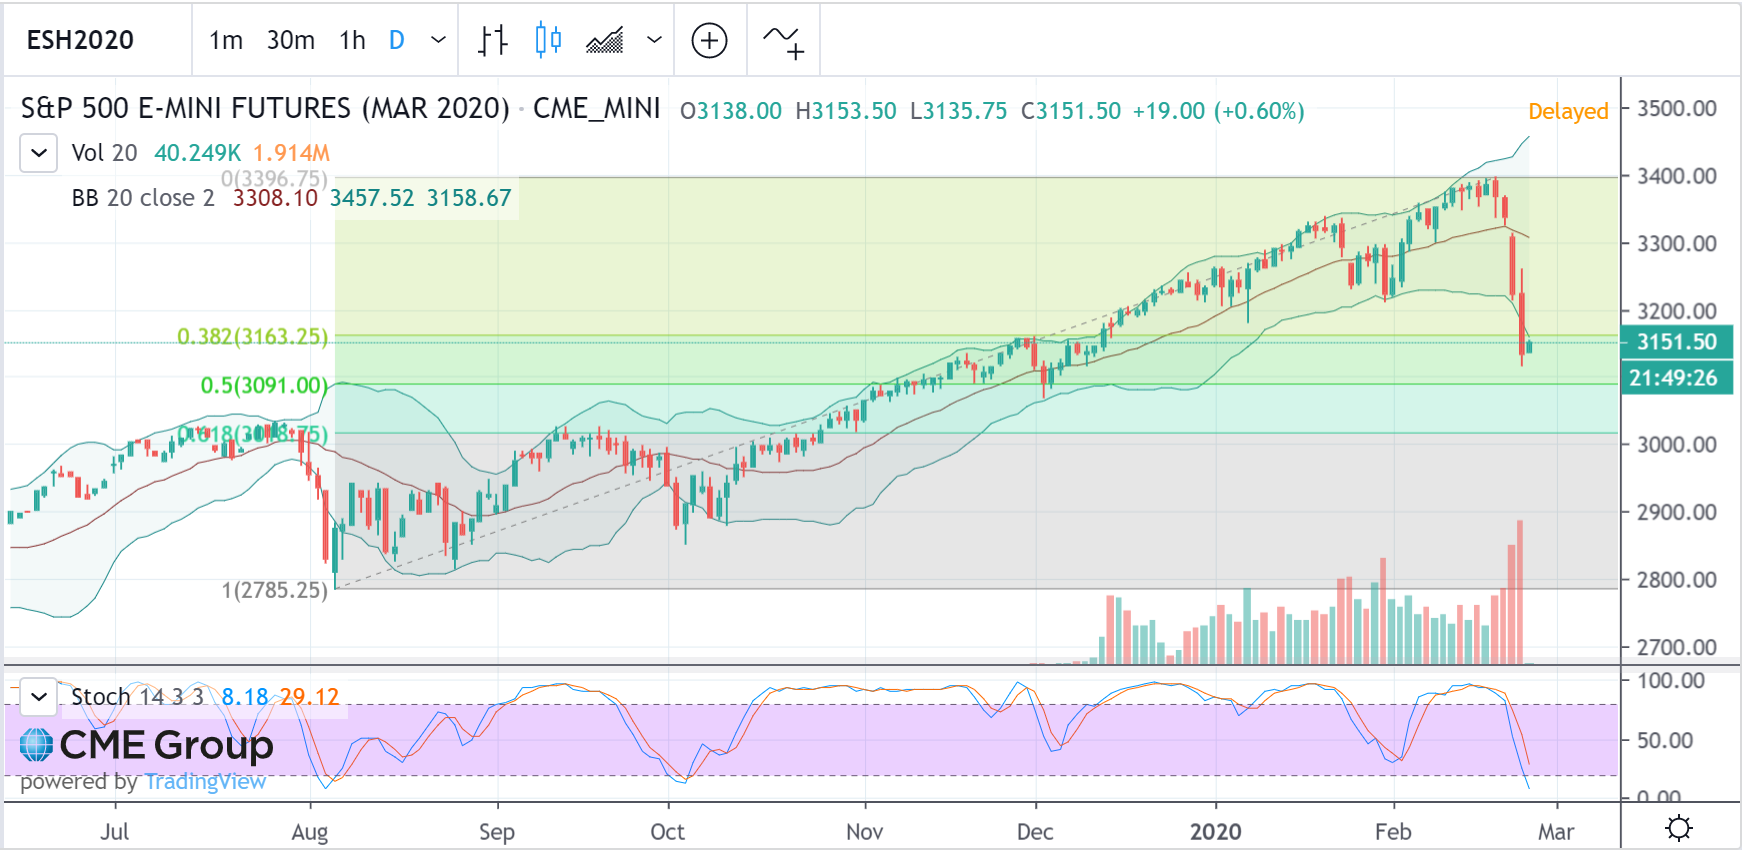
Below are charts for reference.
?ml=1" class="modal_link" data-modal-class-name="no_title">* Tip: Click here on enlarging images
Strategies
The % yield shown in the diagram below represent an estimated return on margin from projected dates shown.
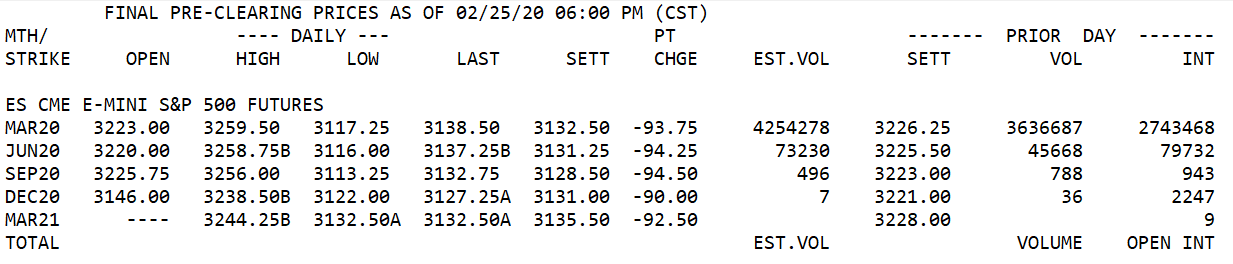
Futures Prices
Options
With free fall on the E-Mini S&P from speculation on economic impact from the Corona virus large volume traded on the following options
Mar 3360 calls
Mar 3400 calls
Feb 3200 puts
Feb 3050 puts
Below is an illustration on inexpensive ES March 3400 call options trading like a cheap lottery ticket to the upside. It's modeled a week out from now to March 3rd with the purple horizontal line illustrating a 1 standard deviation (+/- 68% range) and blue at 2 standard deviations (+/- 95% range).
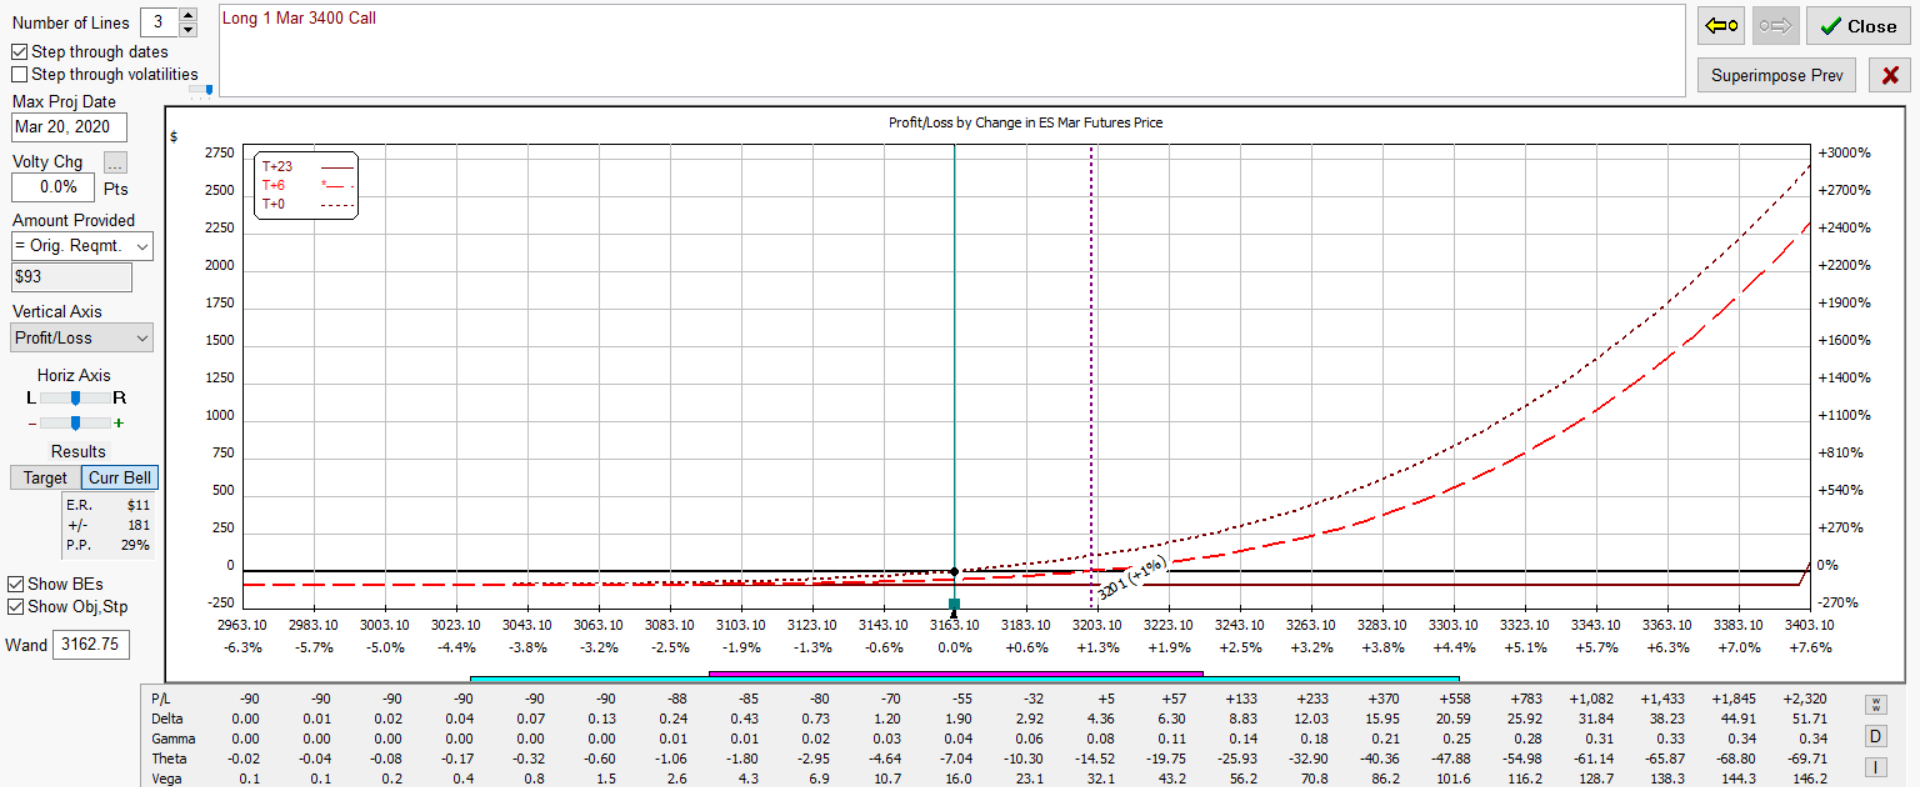
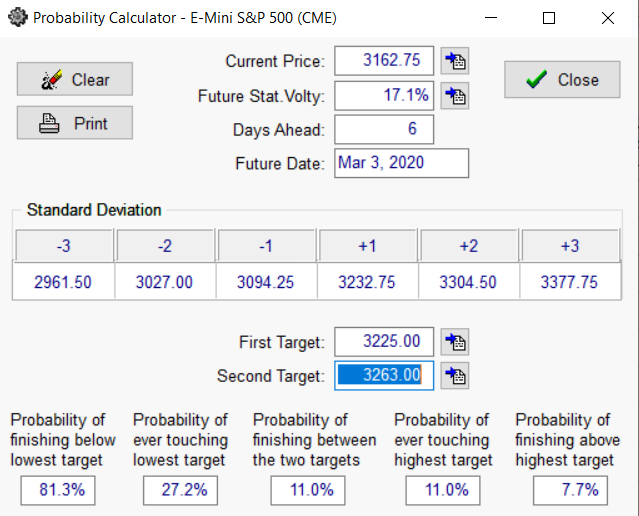
Beneath shows a probability calculator to keep things in perspective.
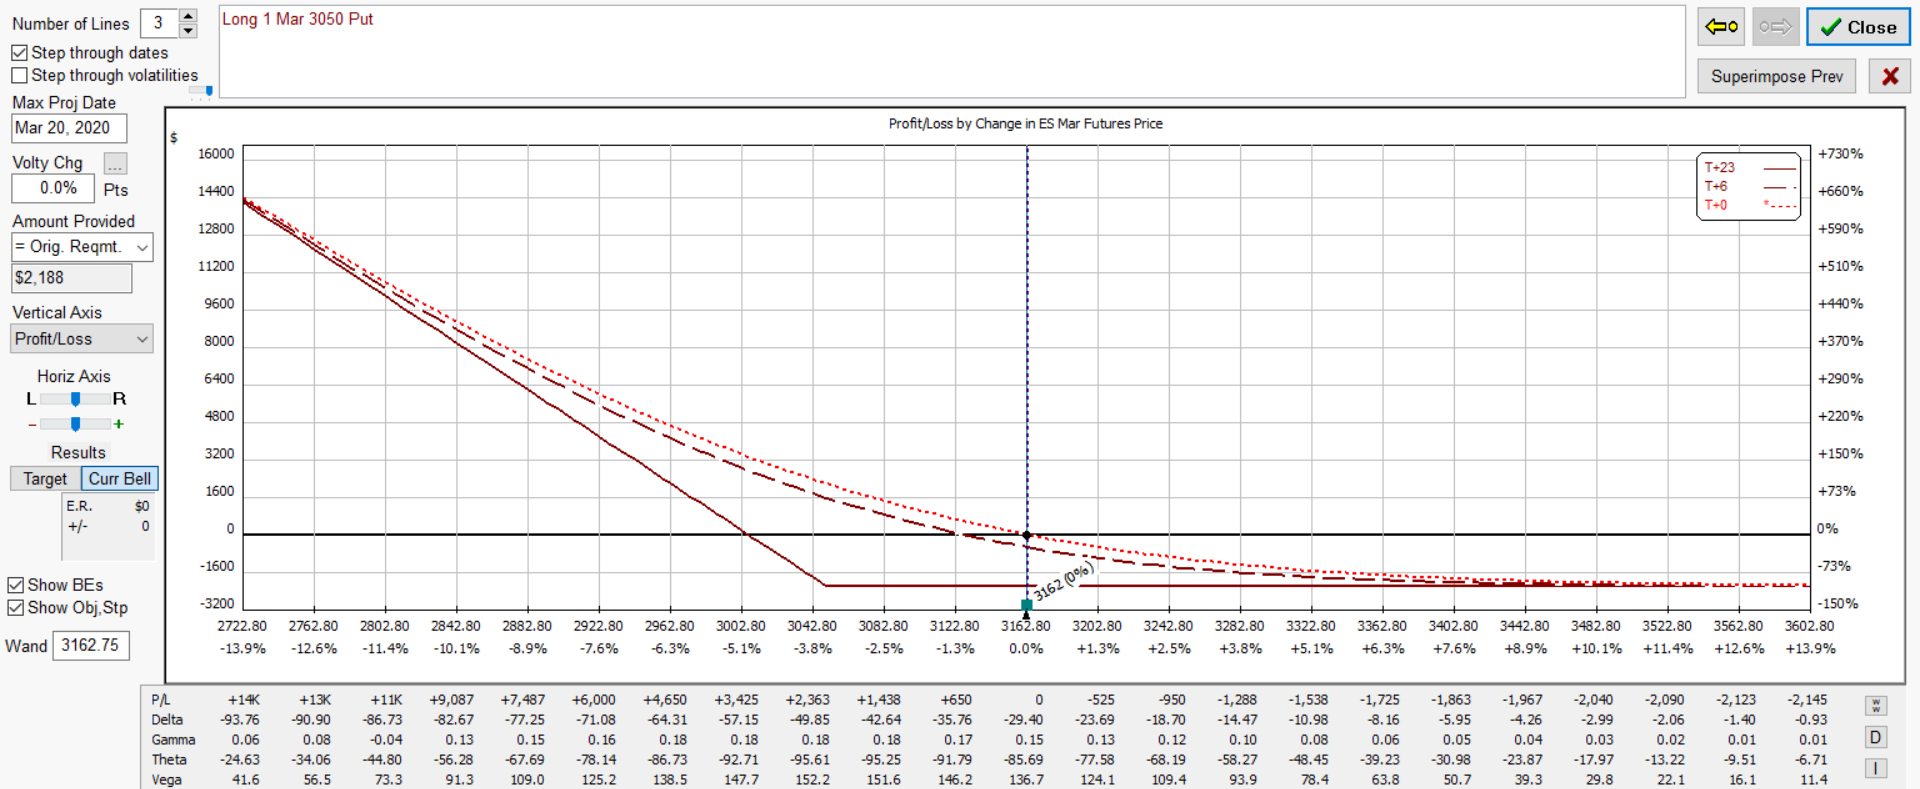
By contrast on the downside, below is the 3050 put
Below is calendar put spread. The position would benefit from a continuing rise in implied volatility should the market continue selling off. It would lose if the market suddenly rallied with drop in implied volatility.
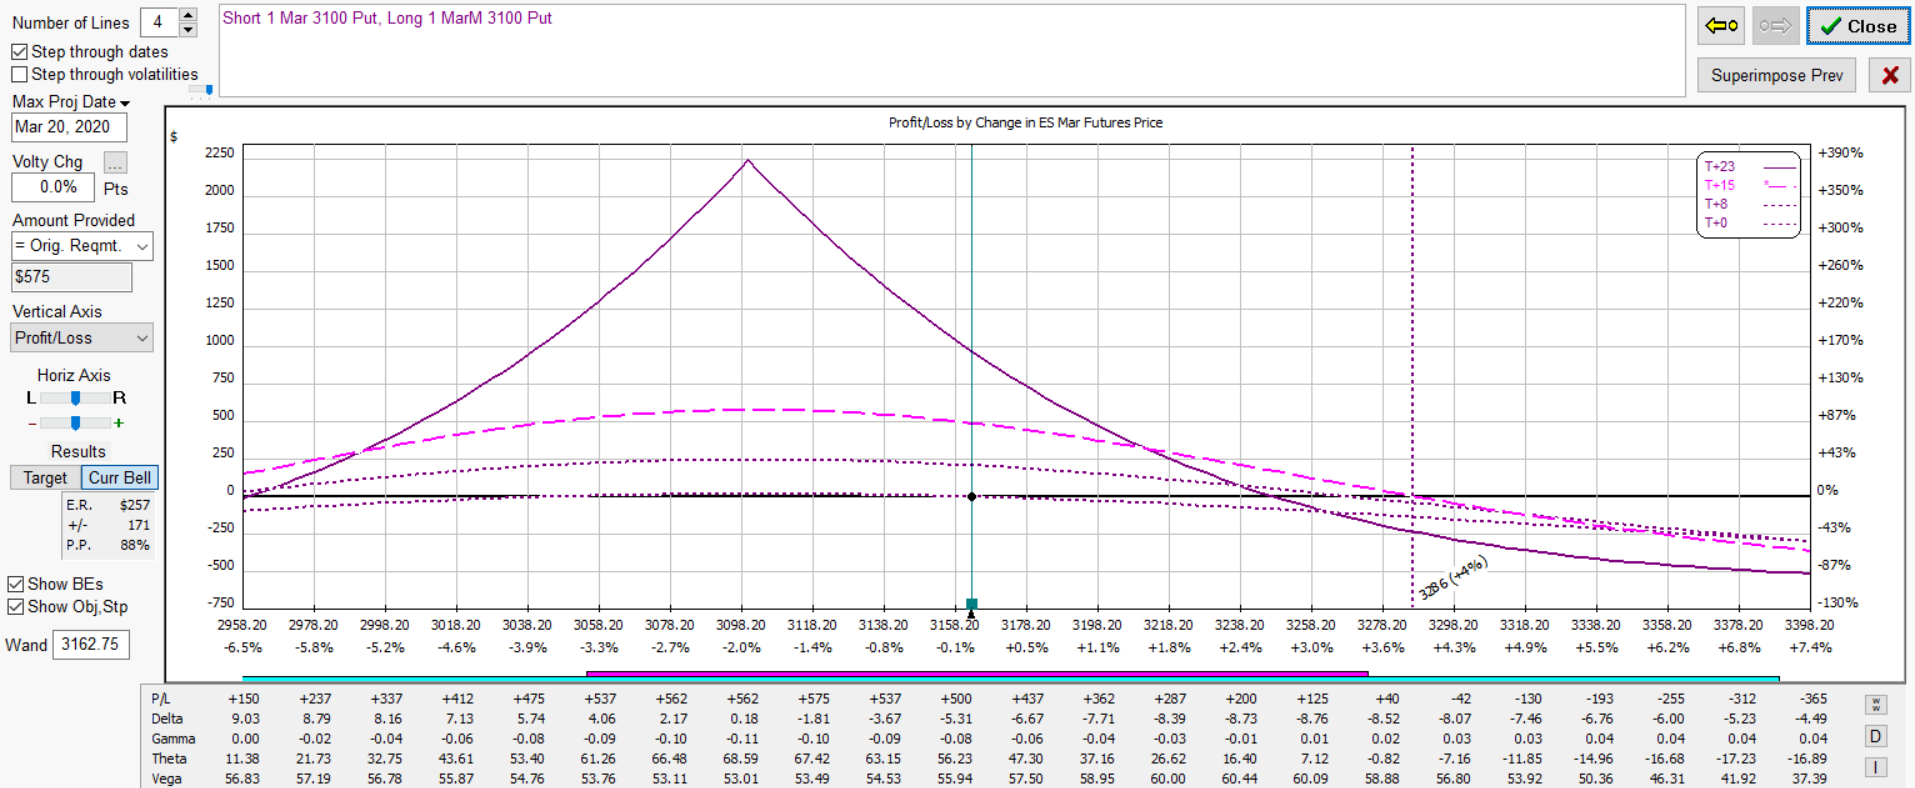
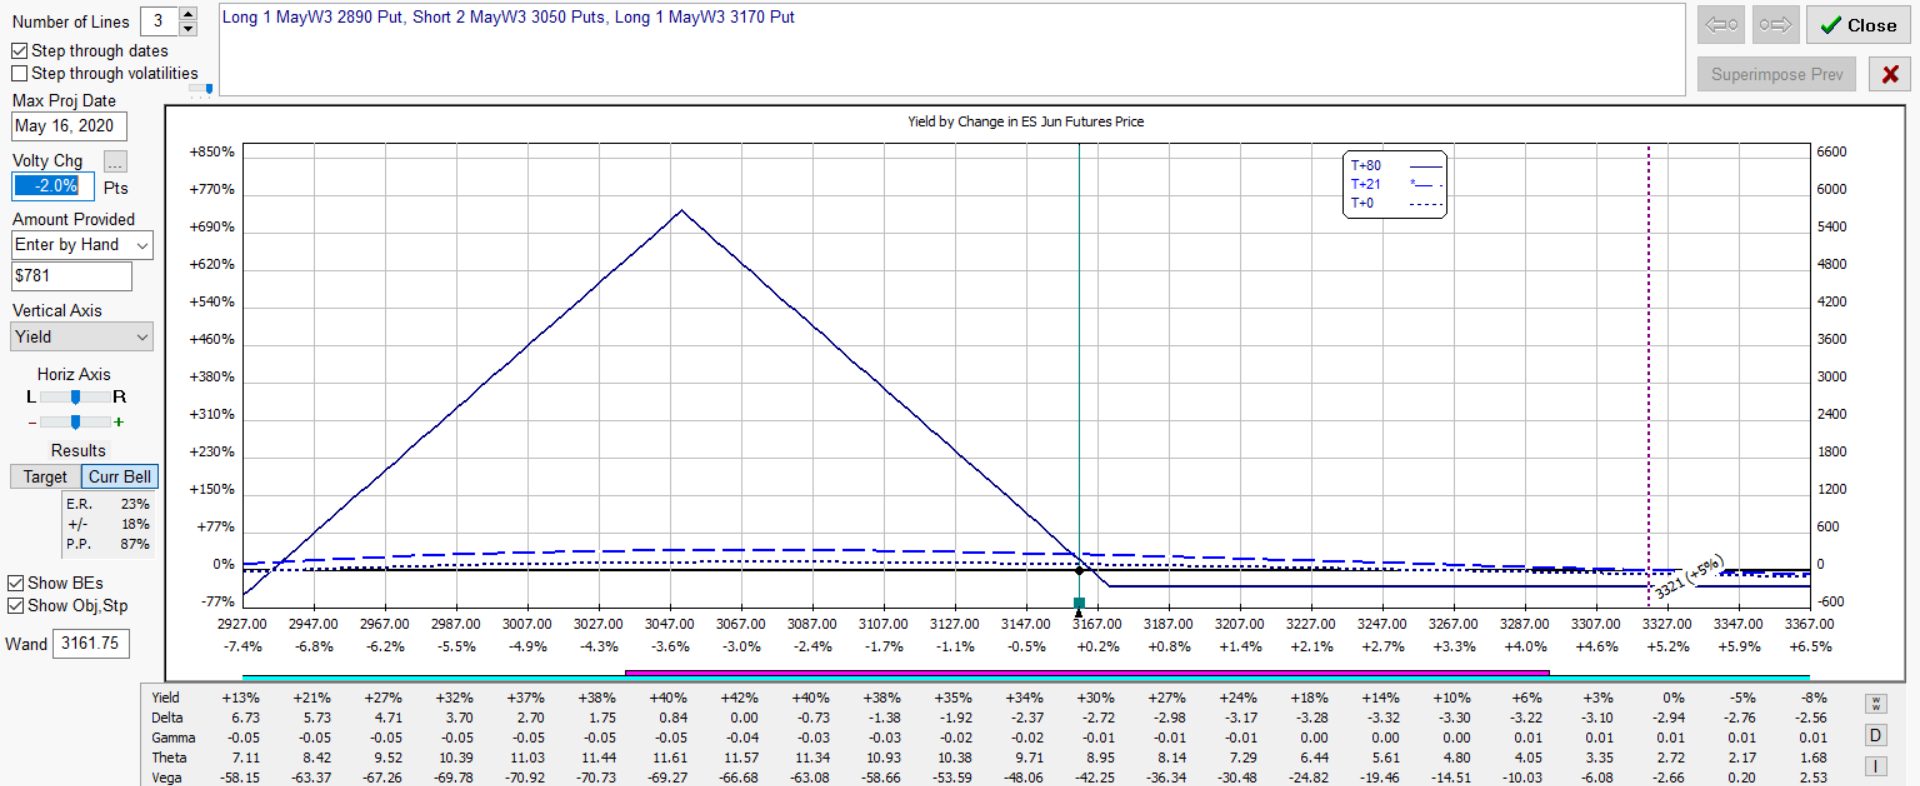
Below is Put Butterfly modeled with a 2 point drop in implied volatility should the market begin to rally a bit.
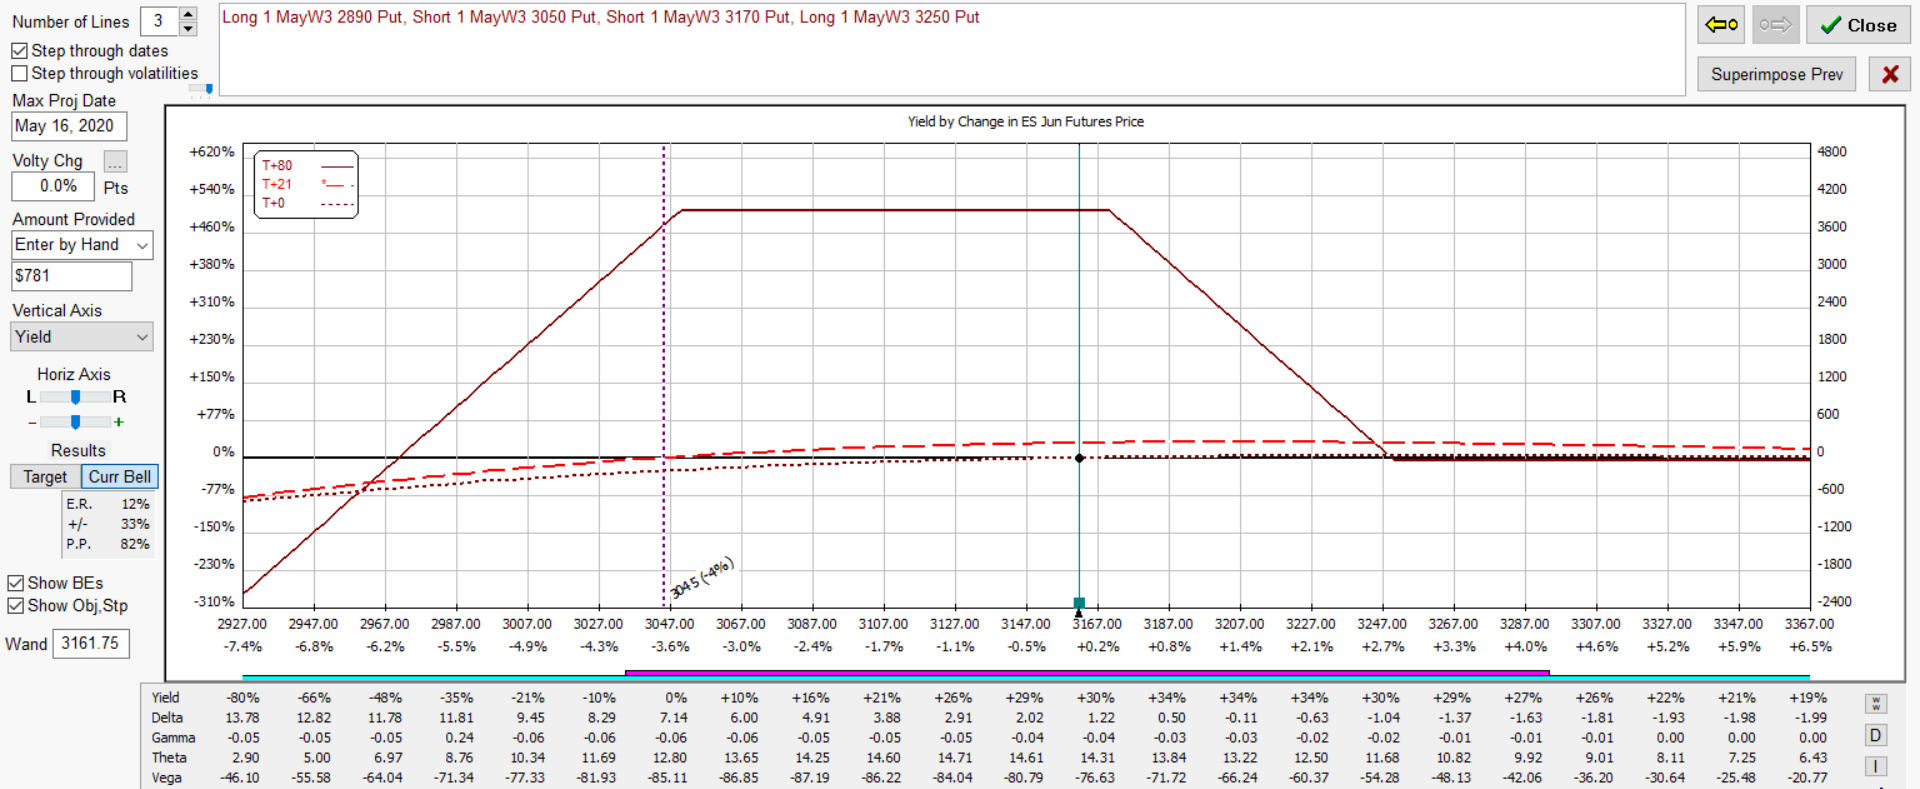
Below is an illustration of adjusting to the upside.
Join our Free Webcast each month and learn how these strategies can benefit your trading.